

10 Year Google Play Retrospective
We’ve combed through a massive report from our friends at App Annie who dive deep in to the last 10 years of the Google Play Store.
App Annies’ giant report can be found here. Or read on since we’ve digested all the info in to the Top 7 Things you should know.
1. YEAR ON YEAR, Revenue Growth Outpaces Downloads
Between 2015 and 2017 the Google Play Store Revenue and Downloads have almost doubled reaching up to $27 Billion Dollars (Projected in 2018). But the rate in which the revenue is increasing is much more than the downloads showing that folks are learning how to make money off of fewer downloads.

2. Google Play generates more than twice the downloads of the iOS App Store.
This might not be surprising to everyone reading who has already released a digital product. But the Google Play Store tends not to make as much revenue per download compared to the iOS store downloads. Research shows that iOS users are just more used to making purchases on their device, exampled by the graph below.

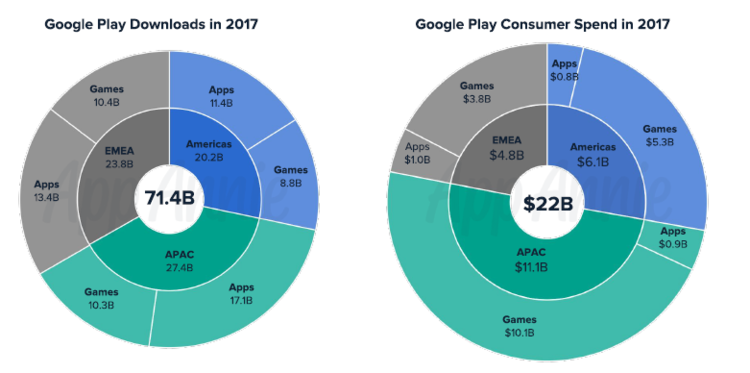
3. The APAC REGION Accounts for Over 50% of Google Play Consumer Spend
It’s worth noting that Google Play isn’t available in China when considering the APAC region accounts for 50% of the Google Play Consumer Spend. So this in-app-purchases (iAP), subscription based services, and upfront costs.
While you might just think it’s due to a larger spending nature in Australia, it’s actually due to the increase in users from Japan, South Korea, Taiwan, and Singapore. Japan especially making up a huge percentage of the total.
If you’re considering releasing a new product, especially for entertainment, consider localisation. It can expand your market significantly.

4. Games Account for 41% of Downloads but 88% of Spend
By far the most staggering differentiation in the report. 88% of all spend on the Google Play Store is on games. If you ever needed a more solid reference to the power of games.
So out of $22 Billion spend in 2017 apps that are not games accounted for only $2.7 Billion. If you haven’t considered at least a layer of gamification on your next digital product then start a conversation now!
5. Nearly 10 Million apps have been released on Google Play
This is the total cumulative apps release on Google Play, worldwide. So over the last five years there has been 7.8 million releases on the store. And with such a small percentage of that being games when you look back at the total revenue it’s a bizarre comparison.

6. The majority of the high performing apps (not games) are subscription based
We’ve talked extensively on Software as a Service, or Subscription based revenue models.
Google actually revamped their subscription models you’re allowed to sell to encourage folks to sell subscriptions as in app purchases. This created an exponential growth and why everyone at 3RD SENSE would strongly suggest doing subscription based revenue model.
And the list below is ignoring games. We do recommend that apps use as many gamification techniques, especially when they’re subscription based.

7. Compare the most downloads and SPEND: 2013 VS 2018
Finally, just for a bit of perspective on app and game trends on the Google Play Store. Seeing the rise of subscription based services like we talked about before. And seeing the apps that have stood the test of time - LINE has been in top for the last 5 years!

